In early May, Bitcoin lost almost 35% of its value and dropped to 27K$ within a week. The rest of the cryptocurrency followed its pattern. A lot of owners of cryptocurrency were in total shock: how could this happen and more important: what lies ahead?
In these times it is important to keep your head cool and to favor the mind over emotion. This is difficult but if you have a rational approach, you will make the right choice that is beneficial in the long run instead of an emotional one that will haunt you for a long time.
Right now, it is important to keep your head cool and to follow the facts of the market that are currently available. An on-chain analysis can do this. The on-chain analysis is an approach, based on chain fundamentals rather than based on hype, sentiment, or technical analysis. This type of analysis can be focused exclusively on one crypto-asset by looking at historical trends or can be used to compare different crypto-assets to identify undervalued/overvalued coins. I will focus on the second option in this post: the general market.
On-Chain Fundamentals
Core on-chain metrics for measuring adoption and general network supply and demand dynamics include:
- Total Market Capitalizations Dominance
- Transaction Fees
- Daily Adjusted Settlement Value
- Daily Active Addresses
- Daily New Addresses
- Daily Transaction Count
- Circulating Supply Growth
You can use these data points to analyze any blockchain network’s demand and supply dynamics. Below I will deep dive into these key dynamics:
Total Market Capitalization Dominance
When you look at the total market capitalization share (market dominance), it helps to describe which assets are seeing an increase or decrease in demand and whether the market sentiment is rotating between Bitcoin and altcoins. Although Bitcoin USD trended lower YTD (Year to Date), altcoins performed worse. This led to a reduction in altcoin market dominance.
Transaction Fees
Transaction fees are a key factor in network demand because they represent the cost that market participants are willing to pay for a transaction on a blockchain ledger. It is important to leave out cryptocurrencies with a static fee rate like SOL (Solana) and ADA (Cardano) because they do not respond to varying levels of network traffic/crowding.
Looking to this current year (2022), on-chain demand is trending down. There were some exceptions (Bitcoin demand increased 2% in May), but the general trend is downwards.
Daily Adjusted Settlement Value
Network transaction volume (on-chain settlement value) is also a good indicator of network demand. It measures the aggregated value of funds that people, participating in the market transfer.
On-chain transaction volume is another key factor (next to transaction fees) for network demand. Looking at the YTD figures, crypto assets have seen mixed demand in 2022. Of all the key coins, only ADA transactions rose YTD (369%). However, after March ADA also declined by about 85% but on balance, it is still a big plus. BTC (-15%), ETH (-49%), DOT (-59%), DOGE (-79%) and ALGO (-82%) all saw their on-chain volume fall.
Daily Active Address
The number of active addresses per day can help you to identify network demand from existing and new market participants. If the number rises, it may indicate an increase in demand among market participants and vice-versa.
This year only SOL (Solana) had rising activity (+121%). The other big cryptocurrencies saw a decrease: BTC (-0,3%), DOT (-8%), ETH (-12%), AVAX (-33%), ADA (-36%) and ALGO (-63%).
Daily new Addresses
If you analyze the number of daily new addresses, you can identify network demand from newer market participants. There is a catch though: existing market participants may also create new wallet addresses so be careful before jumping to conclusions. You should always analyze with a safety margin because of this phenomenon. During this year daily new addresses have fallen for all the important cryptocurrencies.
Daily Transaction Count
The blockchain daily transaction count is also a great indicator of on-chain demand. The reason for this is that it identifies the number of times when network participants are active or inactive. Daily transaction count fell for most altcoins this year, but Bitcoin (BTC) and Cardano (ADA) saw their transaction count rise respectively by 11% and 8%.
Circulating Supply Growth
The circulating supply growth of a crypto asset provides a look at on-chain liquidity. This metric includes tokens that have been unlocked from vesting and/or minted by the blockchain protocol. This piece of data provides insight into the supply dynamics of a crypto asset. If you have an influx of immediately marketable supply, this might pressure market activity. All main cryptocurrencies saw an influx of immediately marketable supply in 2022. An increase in supply growth is a positive indicator (and logical) because it shows that markets are still growing demand > available coins which means that new coins must be minted to fulfill demand.
Market Analysis: current state of the market
On-chain indicators like Bitcoins, Spent Output Profit Ratio (SOPR), and Market Value to Realized Value (MVRV) z-score helps you to determine where the market stands from an on-chain perspective. Because Bitcoin is still the leading cryptocurrency, both SOPR and MVRV should really be analyzed to determine the state of the market.
Spent Output Profit Ratio (SOPR)
The SOPR is used to estimate if a UTXO-based crypto asset like BTC, is in a bear or in a bull cycle. This metric attempts to measure whether market participants are selling at a profit or at a loss. It is calculated by taking a spent output (BTC sent in a transaction) and dividing its realized USD value by its USD value of creation: the price “sold” (sent) divided by the price “paid” (received). Keep the following basic rules:
- SOPR < 1: Indicates market participants are selling BTC at a loss, signaling a potential bottom.
- SOPR > 1: Signals that market participants are selling most BTC for a profit; history suggests a local top might be close.
- SOPR = 1: Implies market participants are selling a high amount of BTC at or around the price purchased, meaning market participants are uncertain about where the price may trend.
In April, Bitcoin’s SOPR was oversold (< 1 at 0.99398) and the trend continued downward in May. However, in mid-May, it started going upward again and I this continues, it might indicate that BTC demand might be returning. As of now, SOPR has been moving freely above and below one without any sign of clear capitulation.
Market Value to Realized Value Ratio
The MVRV z-score compares the difference between a crypto asset’s market cap and the realized value, relative to the standard deviation of its market cap. This gives insight into how much the Bitcoin market cap has deviated above or below its average market cap.
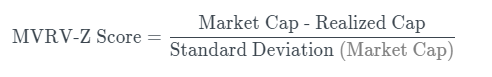
The three key metrics of this formula:
- Market Value (MV): BTC’s price multiplied by coins in circulation, i.e., market capitalization
- Realized Value (RV): The price of each BTC when it was last moved multiplied by coins in circulation.
- Z-Score: A numerical measurement that explains a value’s relationship to a group’s average,
measured in standard deviations. For example, in a normal distribution a z-score of 0 means that a value is identical to the average, and a z-score of 1.0 means that a value is one standard deviation above the average.
The MVRV z-scores give you a good indication if Bitcoin might be “overbought” or “oversold.” When the outcome is > 5, based on history, Bitcoin is “overbought”, while an outcome < 1, based on history, indicates that Bitcoin is “oversold”.
Currently, the Bitcoin MVRV z-score keeps below a reading of 1: prices falter which implies that BTC is in oversold territory. This has historically served as a strong level of support. If this indicator breaks up into neutral territory 1 – 5 and holds as prices rebound, this could imply that network demand is on the rise.
Final Thoughts
Based on this fundamental on-chain data analysis, you can say with quite a lot of certainty that the general crypto asset network demand declined in the period up to now (June). Bitcoin outperformed altcoins in many regards YTD though. It was the first or second-best performer in every on-chain metric that I tracked, and it saw the smallest circulating supply growth year-to-date.
Currently, the market (and indicators) is stabilizing but not improving, indicating that we are still in a bear market but that the market is not losing any real juice. I think, based on what happened in the past few months, the situation with cryptocurrency is not different from shares. There are 3 groups:
- One group that jumps ship
- One group that sticks around but is passive for now in their actions. However, the biggest part of that group is keeping an eye on the market
- One group that remains active, sticks to its investment plan, and still finds ways of opportunity to monetize this market situation.
The moment all indicators are green and show serious recovery, it is the most interesting time to buy (or to go long) and when you keep a close eye on the market you will know, and you can act. During times of a bear market, you learn most about how the market works and how to keep cool.
My advice to you (and to myself) is that it is important to keep staking your cryptocurrencies: do not sell. Currently, it is possible for me again to stake my Cardano at 90 days at 11% instead of 60 days at 8% because of a market that has been cooling down (and the fundamental analysis of this post has proven this as well). And in case you are Dollar-Cost Averaging: stick to your plan and keep buying for the amount you have saved for your crypto wallet, and spread your risk as planned.
Feel free to contact me if you have any questions or if you have any additional advice/tips about this subject. If you want to keep in the loop if I upload a new post, do not forget to subscribe to receive a notification by email.